
from here
On March 11th, 2011 the Tōhoku earthquake and resulting tsunami wreaked havoc on Japan. It also resulted in the largest nuclear disaster since Chernobyl when the tsunami damaged the Fukushima Daiichi Nuclear Power Plant. Radioactive particles were released into the atmosphere and ocean, contaminating groundwater, soil and seawater which effectively closed local Japanese fisheries.
Rather unfortunately, it has also led to some wild speculation on the widespread dangers of Fukushima radiation on the internet. Posts with titles like “Holy Fukushima – Radiation From Japan Is Already Killing North Americans” and ”28 Signs That The West Coast Is Being Absolutely Fried With Nuclear Radiation From Fukushima” (which Southern Fried Science has already throughly debunked ) keep popping up on my facebook feed from well-meaning friends.
I’m here to tell you that these posts are just plain garbage. While there are terrible things that happened around the Fukushima Power Plant in Japan; Alaska, Hawaii and the West Coast aren’t in any danger. These posts were meant to scare people (and possibly written by terrified authors). They did just that, but there is a severe lack of facts in these posts. Which is why I am here to give you the facts, and nothing but the facts.
WHAT WAS RELEASED INTO THE OCEAN AT FUKUSHIMA?
The radioactive rods in the Fukushima power plant are usually cooled by seawater [CORRECTION: they are usually cooled by freshwater. As a last ditch emergency effort at Fukushima seawater was used as a coolant.]. The double whammy of an earthquake and a tsunami pretty much released a shitstorm of badness: the power went out, meltdown started and eventually the radioactive cooling seawater started leaking (and was also intentionally released) into the ocean. Radioactive isotopes were also released into the air and were absorbed by the ocean when they rained down upon it. These two pathways introduced mostly Iodine-131, Cesium-137, and Cesium-134, but also a sprinkling of Tellurium, Uranium and Strontium to the area surrounding the power plant.
There aren’t great estimates of how much of each of these isotopes were released into the ocean since TEPCO, the company that owns the power plant hasn’t exactly been forthcoming with information, but the current estimates are around 538,100 terabecquerels (TBq) which is above Three-Mile Island levels, but below Chernobyl levels. And as it turns out, they recently found contaminated groundwater has also started leaking into the sea. TEPCO, the gift that keeps on giving.
WHAT’S A BEQUEREL? WHAT’S A SIEVERT?
Units of Radiation are confusing. When you start reading the news/literature/blogs, there are what seems like a billion different units to explain radiation. But fear not, I’ve listed them below and what they mean (SI units first).
Becquerel[Bq] or Curie[Ci]: radiation emitted from a radioactive material (1 Ci = 3.7 × 10¹⁰ Bq)
Gray [Gy] or Rad[rad]: radiation absorbed by another material (1Gy = 100 rad)
Sieverts[Sv]* or “roentgen equivalent in man”[rem]: how badly radiation will damage biological tissue (1 Sv = 100 rem)
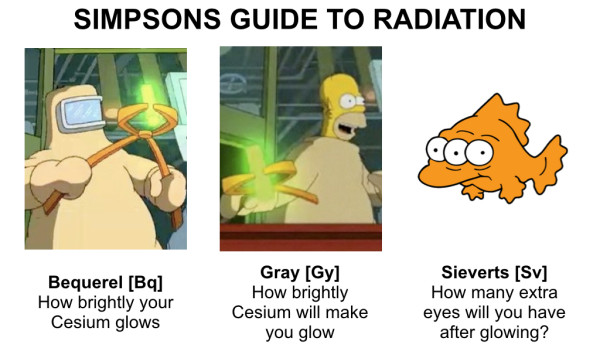
You can convert from Grays and Rads to Rem and Sieverts, but you have to know what kind of radiation it is. For example alpha radiation from naturally occurring Polonium-210 is more damaging to biological tissues than gamma radiation from Cesium-137. Even if you absorbed the same number of Grays from Cesium or Polonium, you would still effectively receive more damaging radiation from Polonium because the number of Sieverts is higher for Polonium than Cesium. And kids, Sieverts and Seavers are both dangerous to your health but please don’t confuse them.
WHAT’S CESIUM-137?
Cesium-137 is product of nuclear fission. Before us humans, there was no Cesium-137 on earth. But then we started blowing stuff up with nuclear bombs and VOILA!, there are now detectable, but safe, levels of Cesium-137 in all the world oceans.
WHAT DO THE MAPS OF FUKUSHIMA RADIATION IN THE PACIFIC REALLY TELL US?
There are a bunch of maps being thrown around on the internet as evidence that we are all going to die from Fukushima radiation. I’m going to dissect them here. Apologies in advance for dose of snark in this section because some of these claims are just god awful. Spoiler: radiation probably has reached the West Coast but it’s not dangerous.
MAP OF TERROR #1: The Rays of Radioactive Death!
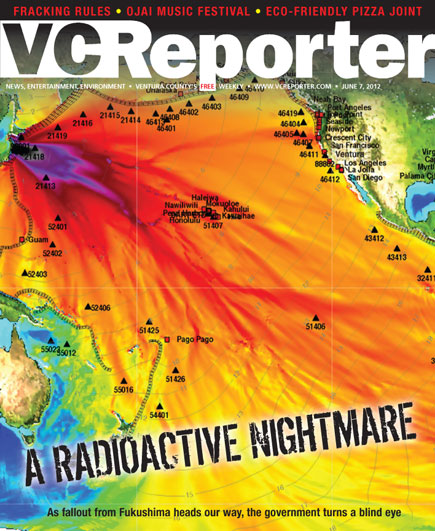
[source: http://www.enviroreporter.com/investigations/fukushima/a-radioactive-nightmare/]This is not a map of Fukushima Radiation spreading across the Pacific. This is a map of the estimated maximum wave heights of the Japanese Tohuku Tsunami by modelers at NOAA. In fact, tsunamis don’t even transport particles horizontally in the deep ocean. So there is no way a Tsunami could even spread radiation (except maybe locally at scales of several miles as the wave breaks onshore). Dear VC reporter, I regret to inform you this cover image could be the poster child for the importance of journalistic fact-checking for years to come.
MAP OF TERROR #2: EHRMAGHAD radioactive SPAGHATTA NADLES attack Hawaii!

I mean I guess this is a bit better. At least this map used an ocean model that actually predicts where radioactive particles will be pushed around by surface ocean currents. But it still gets a BIG FAT FAIL. The engineering company that put this image/piece of crap out there couldn’t even be bothered to put a legend on the map. Their disclaimer says “THIS IS NOT A REPRESENTATION OF THE RADIOACTIVE PLUME CONCENTRATION.” Then what do the colors mean?
MAP OF TERROR #3: THE BLOB!
 It’s true, oceanographic models have shown that radiation from Fukushima has probably already hit Aleutians and Hawaiian Island chain, and should reach the California Coast by Fall 2014 [Behrens et al. 2012]. The map above is showing the spread of Cesium-137 from the Fukushima reactor would look like right now, I mean radiation is apparently EVERYWHERE! But what is missing from most of the discussion of these maps is what the colors ACTUALLY mean.
We shall now seek guidance from the little box in the upper right hand corner of the map called the legend**. The colors show how much less radioactive the the decrease in the radioactive concentrations of Cesium-137 isotopes have become since being emitted from Fukushima. For example, the red areas indicate the Fukushima Cesium-137 is now more than 10,000 times less radioactive concentrated than when released. The California Coast, more than a million times less. The punchline is that overall concentrations of radioactive isotopes and therefore radioactivity in the Pacific will increase from Pre-Fukushima levels, but it will be way less than what was seen in coastal Japan and definitely not enough to be harmful elsewhere (we’ll get to more of that later).
** As Eve Rickert has thoughtfully pointed out, my description of the image is a little confusing. I’ve added corrections in blue to clarify.
HOW MUCH RADIATION WILL REACH THE WEST COAST?
Practically, what does ten thousand or a million times less radiation mean? It means that these models estimate the West Coast and the Aleutians will see radiation levels anywhere from 1-20 Bq/m3,while Hawaiian Islands could see up to 30 Bq/m3 [Behrens et al. 2012, Nakano et al. 2012, Rossi et al. 2013 ].
I could write a small novel explaining why the numbers differ between the models. For those that love the details, here’s a laundry list of those differences: the amount of radiation initially injected into the ocean, the length of time it took to inject the radiation (slowly seeping or one big dump), the physics embedded in the model, the background ocean state, the number of 20-count shrimp per square mile (Just kidding!), atmospheric forcing, inter-annual and multi-decadal variability and even whether atmospheric deposition was incorporated into the model.
Like I said before, the West Coast will probably not see more than 20 Bq/m3 of radiation. Compare these values to the map of background radiation of Cesium-137 in the ocean before Fukushima (from 1990), it’s only 4 Bq/m3 in the Pacific. Radiation will increase in the Pacific, but it’s at most 10 times higher than previous levels, not thousands. Although looking at this map I would probably stop eating Baltic Herring fish oil pills and Black Sea Caviar (that radiation is from Chernobyl) before ending the consumption of fish from the Pacific Ocean.
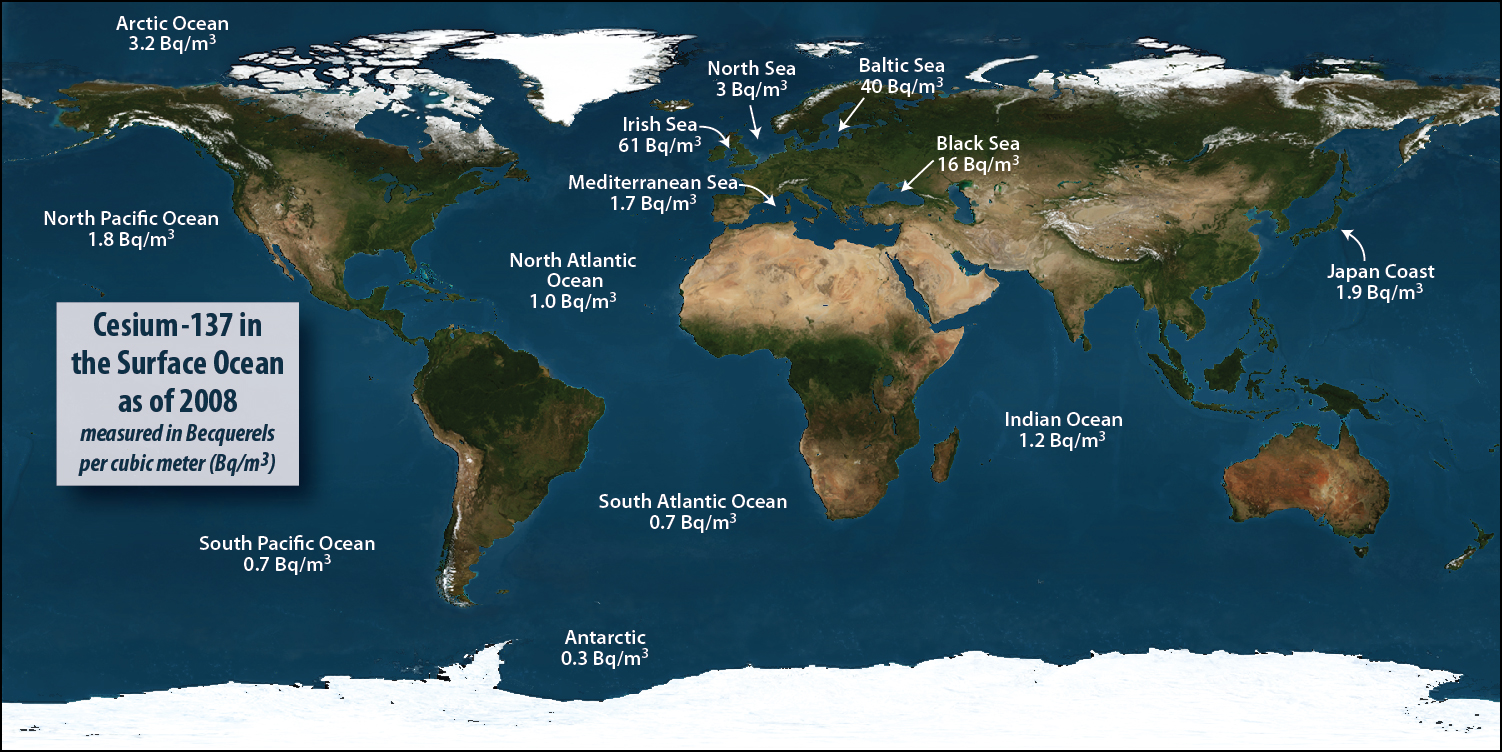
[source: http://www.whoi.edu/page.do?pid=83397&tid=3622&cid=94989]
WILL THE RADIATION REACHING THE WEST COAST BE DANGEROUS?
No it will not be dangerous. Even within 300 km of Fukushima, the additional radiation that was introduced by the Cesium-137 fallout is still well below the background radiation levels from naturally occurring radioisotopes. By the time those radioactive atoms make their way to the West Coast it will be even more diluted and therefore not dangerous at all.
It’s not even dangerous to swim off the coast of Fukushima. Buessler et al. figured out how much radiation damage you would get if you doggie paddled about Fukushima (Yes, science has given us radioactive models of human swimmers). It was less than 0.03% of the daily radiation an average Japanese resident receives. Tiny! Hell, the radiation was so small even immediately after the accident scientists did not wear any special equipment to handle the seawater samples (but they did wear detectors just in case). If you want danger, you’re better off licking the dial on an old-school glow in the dark watch.
CAN I EAT FISH FROM THE PACIFIC?
For the most part the answer is YES. Some fisheries in Japan are still closed because of radioactive contamination. Bottom fish are especially prone to contamination because the fallout collects on the seafloor where they live. Contaminated fish shouldn’t be making it to your grocery store, but I can’t guarantee that so if you are worried just eat fish from somewhere other than Japan.
Fish from the rest of the Pacific are safe. To say it mildly, most fish are kinda lazy. They really don’t travel that far so when you catch a Mahi Mahi off the coast of Hawaii its only going to be as contaminated as the water there, which isn’t very much.Hyperactive fish, such as tuna may be more radioactive than local lazy fish because they migrate so far. As Miriam pointed out in this post, there is a detectable increase of radiation in tuna because they were at one point closer to Fukushima, but the levels are not hazardous.
To alleviate fears that you may be glowing due to ingestion too many visits to your local sushi joint, Fischer et al. figured out exactly how much damaging radiation you would receive from eating a tower of tuna rolls. Seriously. Science is just that awesome. Supermarket tuna hunters would receive 0.9 μSv of radiation, while the outdoors subsistence tuna hunter would receive 4.7 μSv. These values are about the same or a little less than the amount a person receives from natural sources.
To put 0.9 μSv of radiation in perspective check out this awesome graph of radiation by xkcd. You’ll get the same amount of radiation by eating 9 bananas. Monkeys might be doomed, but you are not.
I EAT PACIFIC FISH AND SO CAN YOU!
I hope this list of facts has answered most of your questions and convinced you the Pacific and its inhabitants will not be fried by radiation from Fukushima. I certainly feel safe eating sustainable seafood from the Pacific and so should you. If you are still unsure, please feel free to ask questions in the comments section below.
UPDATE #1: CONTRIBUTIONS FROM GROUNDWATER LEAKS
There’s been a lot of discussion in the comments about the contribution from the groundwater leaks. I did some homework and here’s what I came up with. (Also thanks to everyone for the interesting discussions in the comments!)
The ground water leaks are in fact problematic, but what has been released into the ocean is MUCH less than the initial release (although I admit the groundwater itself has extremely high radiation levels). The estimates from Jota Kanda are that 0.3 TBq per month (1012 Bq) of contaminated groundwater is leaking into the ocean, which has added another 9.6 TBq of radiation into the sea at most. The initial releases were about 16.2 PBq (1015 Bq), about 1500 times more radiation. With this in mind, the additional radioactivity leak from ground water isn’t a relatively large addition to the ocean.
The models by Behrens and Rossi used initial source functions of 10 PBq and 22 PBq, which is on par with the most recent estimates. Since their models used a much higher source function, that says to me that this relatively smaller input from groundwater still won’t raise the radioactivity to dangerous levels on the West Coast, Alaska and Hawaii. Recent observations around Hawaii by Kamenik et al. also suggest that the models may have even overestimated the amount of radiation that hit Hawaii, which is good news.
But there are caveats to this information as well. The leaking groundwater contains strontium and tritium which are more problematic than Cesium-137. But it sounds like strontium accumulates in bones and is only a problem if you eat small fish with the bones in, like sardines (and it will only affect sardines caught near Japan since they don’t travel far). I suspect there might be some precedent for understanding the dangers of tritium in seawater from the 20th century nuclear testing in atolls, but I really don’t know. There is also 95 TBq of radioactive cesium is in the sediment around Fukushima, which is still super problematic for bottom dwelling fish and therefore local Japanese Fisheries. Lastly, another source is terrestrial runoff. These numbers haven’t been quantified but they are probably minor because they contain a fraction of the total deposition from atmospheric fallout, which itself was a fraction of what was released into the ocean.
So even with the new groundwater leaks, the available evidence still tells me I can eat fish from the West Coast, Hawaii, and Alaska.
http://www.nature.com/news/ocean-still-suffering-from-fukushima-fallout-1.11823
http://www.biogeosciences.net/10/6045/2013/bg-10-6045-2013.pdf
http://newswatch.nationalgeographic.com/2013/09/11/fukushima-fallout-not-affecting-u-s-caught-fish/
UPDATE #2: ANOTHER GREAT RESOURCE FOR LEARNING ABOUT THE SCIENCE OF FUKUSHIMA RADIATION
For more in depth articles about radiation from Fukushima in the ocean you should definitely check out some of Marine Chemist’s Posts at Daily Kos. Written by Jay T. Cullen, a Marine Chemist at the University of Victoria, the posts walk you through the most current research on Fukushima Radiation from a variety of sources. I especially recommend his most recent post on Update on Fukushima Radionuclides in the North Pacific and Off the West Coast of North America, were he discusses the recent detection of Fukushima radiation off the coast of Canada. The most recent observations from June 2013 shows the spread of Cesium-137 was on par with the predictions by Rossi et al., but the concentrations are safe and lower than predicted.
[DISCLAIMER: The creators of the NOAA tsunami map work in my building. I secretly fangirl squeal when I walk past their offices. I recently had coffee with Joke F. Lübbecke, who also works in my building. It was caffeinated.]
*Confusingly, oceanographers also co-opted the acronym Sv for Sverdrups their unit for volume transport. 1 Sverdrup = 1 Sv = one million cubic metres per second = 400 Olympic swimming pools just passed your house in one second.
SOURCES:
Behrens, Erik, et al. “Model simulations on the long-term dispersal of 137Cs released into the Pacific Ocean off Fukushima.” Environmental Research Letters 7.3 (2012): 034004.
Buesseler, Ken O., et al. “Fukushima-derived radionuclides in the ocean and biota off Japan.” Proceedings of the National Academy of Sciences 109.16 (2012): 5984-5988.
Fisher, Nicholas S., et al. “Evaluation of radiation doses and associated risk from the Fukushima nuclear accident to marine biota and human consumers of seafood.” Proceedings of the National Academy of Sciences (2013).
Nakano, Masanao, and Pavel P. Povinec. “Long-term simulations of the 137 Cs dispersion from the Fukushima accident in the world ocean.“ Journal of environmental radioactivity 111 (2012): 109-115.
Rossi, Vincent, et al. “Multi-decadal projections of surface and interior pathways of the Fukushima Cesium-137 radioactive plume.“ Deep Sea Research Part I: Oceanographic Research Papers (2013).
Woods Hole Oceanographic Institution FAQ: Radiation from Fukushima
Explained: rad, rem, sieverts, becquerelsl. A guide to terminology about radiation exposure
WHAT’S CESIUM-137?
Cesium-137 is product of nuclear fission. Before us humans, there was no Cesium-137 on earth. But then we started blowing stuff up with nuclear bombs and VOILA!, there are now detectable, but safe, levels of Cesium-137 in all the world oceans.
WHAT DO THE MAPS OF FUKUSHIMA RADIATION IN THE PACIFIC REALLY TELL US?
There are a bunch of maps being thrown around on the internet as evidence that we are all going to die from Fukushima radiation. I’m going to dissect them here. Apologies in advance for dose of snark in this section because some of these claims are just god awful. Spoiler: radiation probably has reached the West Coast but it’s not dangerous.
MAP OF TERROR #1: The Rays of Radioactive Death!
[source: http://www.enviroreporter.com/investigations/fukushima/a-radioactive-nightmare/]This is not a map of Fukushima Radiation spreading across the Pacific. This is a map of the estimated maximum wave heights of the Japanese Tohuku Tsunami by modelers at NOAA. In fact, tsunamis don’t even transport particles horizontally in the deep ocean. So there is no way a Tsunami could even spread radiation (except maybe locally at scales of several miles as the wave breaks onshore). Dear VC reporter, I regret to inform you this cover image could be the poster child for the importance of journalistic fact-checking for years to come.
MAP OF TERROR #2: EHRMAGHAD radioactive SPAGHATTA NADLES attack Hawaii!
I mean I guess this is a bit better. At least this map used an ocean model that actually predicts where radioactive particles will be pushed around by surface ocean currents. But it still gets a BIG FAT FAIL. The engineering company that put this image/piece of crap out there couldn’t even be bothered to put a legend on the map. Their disclaimer says “THIS IS NOT A REPRESENTATION OF THE RADIOACTIVE PLUME CONCENTRATION.” Then what do the colors mean?
MAP OF TERROR #3: THE BLOB!
We shall now seek guidance from the little box in the upper right hand corner of the map called the legend**. The colors show how much less radioactive the the decrease in the radioactive concentrations of Cesium-137 isotopes have become since being emitted from Fukushima. For example, the red areas indicate the Fukushima Cesium-137 is now more than 10,000 times less radioactive concentrated than when released. The California Coast, more than a million times less. The punchline is that overall concentrations of radioactive isotopes and therefore radioactivity in the Pacific will increase from Pre-Fukushima levels, but it will be way less than what was seen in coastal Japan and definitely not enough to be harmful elsewhere (we’ll get to more of that later).
** As Eve Rickert has thoughtfully pointed out, my description of the image is a little confusing. I’ve added corrections in blue to clarify.
HOW MUCH RADIATION WILL REACH THE WEST COAST?
Practically, what does ten thousand or a million times less radiation mean? It means that these models estimate the West Coast and the Aleutians will see radiation levels anywhere from 1-20 Bq/m3,while Hawaiian Islands could see up to 30 Bq/m3 [Behrens et al. 2012, Nakano et al. 2012, Rossi et al. 2013 ].
I could write a small novel explaining why the numbers differ between the models. For those that love the details, here’s a laundry list of those differences: the amount of radiation initially injected into the ocean, the length of time it took to inject the radiation (slowly seeping or one big dump), the physics embedded in the model, the background ocean state, the number of 20-count shrimp per square mile (Just kidding!), atmospheric forcing, inter-annual and multi-decadal variability and even whether atmospheric deposition was incorporated into the model.
Like I said before, the West Coast will probably not see more than 20 Bq/m3 of radiation. Compare these values to the map of background radiation of Cesium-137 in the ocean before Fukushima (from 1990), it’s only 4 Bq/m3 in the Pacific. Radiation will increase in the Pacific, but it’s at most 10 times higher than previous levels, not thousands. Although looking at this map I would probably stop eating Baltic Herring fish oil pills and Black Sea Caviar (that radiation is from Chernobyl) before ending the consumption of fish from the Pacific Ocean.
[source: http://www.whoi.edu/page.do?pid=83397&tid=3622&cid=94989]
WILL THE RADIATION REACHING THE WEST COAST BE DANGEROUS?
No it will not be dangerous. Even within 300 km of Fukushima, the additional radiation that was introduced by the Cesium-137 fallout is still well below the background radiation levels from naturally occurring radioisotopes. By the time those radioactive atoms make their way to the West Coast it will be even more diluted and therefore not dangerous at all.
It’s not even dangerous to swim off the coast of Fukushima. Buessler et al. figured out how much radiation damage you would get if you doggie paddled about Fukushima (Yes, science has given us radioactive models of human swimmers). It was less than 0.03% of the daily radiation an average Japanese resident receives. Tiny! Hell, the radiation was so small even immediately after the accident scientists did not wear any special equipment to handle the seawater samples (but they did wear detectors just in case). If you want danger, you’re better off licking the dial on an old-school glow in the dark watch.
CAN I EAT FISH FROM THE PACIFIC?
For the most part the answer is YES. Some fisheries in Japan are still closed because of radioactive contamination. Bottom fish are especially prone to contamination because the fallout collects on the seafloor where they live. Contaminated fish shouldn’t be making it to your grocery store, but I can’t guarantee that so if you are worried just eat fish from somewhere other than Japan.
Fish from the rest of the Pacific are safe. To say it mildly, most fish are kinda lazy. They really don’t travel that far so when you catch a Mahi Mahi off the coast of Hawaii its only going to be as contaminated as the water there, which isn’t very much.Hyperactive fish, such as tuna may be more radioactive than local lazy fish because they migrate so far. As Miriam pointed out in this post, there is a detectable increase of radiation in tuna because they were at one point closer to Fukushima, but the levels are not hazardous.
To alleviate fears that you may be glowing due to ingestion too many visits to your local sushi joint, Fischer et al. figured out exactly how much damaging radiation you would receive from eating a tower of tuna rolls. Seriously. Science is just that awesome. Supermarket tuna hunters would receive 0.9 μSv of radiation, while the outdoors subsistence tuna hunter would receive 4.7 μSv. These values are about the same or a little less than the amount a person receives from natural sources.
To put 0.9 μSv of radiation in perspective check out this awesome graph of radiation by xkcd. You’ll get the same amount of radiation by eating 9 bananas. Monkeys might be doomed, but you are not.
I EAT PACIFIC FISH AND SO CAN YOU!
I hope this list of facts has answered most of your questions and convinced you the Pacific and its inhabitants will not be fried by radiation from Fukushima. I certainly feel safe eating sustainable seafood from the Pacific and so should you. If you are still unsure, please feel free to ask questions in the comments section below.
UPDATE #1: CONTRIBUTIONS FROM GROUNDWATER LEAKS
There’s been a lot of discussion in the comments about the contribution from the groundwater leaks. I did some homework and here’s what I came up with. (Also thanks to everyone for the interesting discussions in the comments!)
The ground water leaks are in fact problematic, but what has been released into the ocean is MUCH less than the initial release (although I admit the groundwater itself has extremely high radiation levels). The estimates from Jota Kanda are that 0.3 TBq per month (1012 Bq) of contaminated groundwater is leaking into the ocean, which has added another 9.6 TBq of radiation into the sea at most. The initial releases were about 16.2 PBq (1015 Bq), about 1500 times more radiation. With this in mind, the additional radioactivity leak from ground water isn’t a relatively large addition to the ocean.
The models by Behrens and Rossi used initial source functions of 10 PBq and 22 PBq, which is on par with the most recent estimates. Since their models used a much higher source function, that says to me that this relatively smaller input from groundwater still won’t raise the radioactivity to dangerous levels on the West Coast, Alaska and Hawaii. Recent observations around Hawaii by Kamenik et al. also suggest that the models may have even overestimated the amount of radiation that hit Hawaii, which is good news.
But there are caveats to this information as well. The leaking groundwater contains strontium and tritium which are more problematic than Cesium-137. But it sounds like strontium accumulates in bones and is only a problem if you eat small fish with the bones in, like sardines (and it will only affect sardines caught near Japan since they don’t travel far). I suspect there might be some precedent for understanding the dangers of tritium in seawater from the 20th century nuclear testing in atolls, but I really don’t know. There is also 95 TBq of radioactive cesium is in the sediment around Fukushima, which is still super problematic for bottom dwelling fish and therefore local Japanese Fisheries. Lastly, another source is terrestrial runoff. These numbers haven’t been quantified but they are probably minor because they contain a fraction of the total deposition from atmospheric fallout, which itself was a fraction of what was released into the ocean.
So even with the new groundwater leaks, the available evidence still tells me I can eat fish from the West Coast, Hawaii, and Alaska.
http://www.nature.com/news/ocean-still-suffering-from-fukushima-fallout-1.11823
http://www.biogeosciences.net/10/6045/2013/bg-10-6045-2013.pdf
http://newswatch.nationalgeographic.com/2013/09/11/fukushima-fallout-not-affecting-u-s-caught-fish/
UPDATE #2: ANOTHER GREAT RESOURCE FOR LEARNING ABOUT THE SCIENCE OF FUKUSHIMA RADIATION
For more in depth articles about radiation from Fukushima in the ocean you should definitely check out some of Marine Chemist’s Posts at Daily Kos. Written by Jay T. Cullen, a Marine Chemist at the University of Victoria, the posts walk you through the most current research on Fukushima Radiation from a variety of sources. I especially recommend his most recent post on Update on Fukushima Radionuclides in the North Pacific and Off the West Coast of North America, were he discusses the recent detection of Fukushima radiation off the coast of Canada. The most recent observations from June 2013 shows the spread of Cesium-137 was on par with the predictions by Rossi et al., but the concentrations are safe and lower than predicted.
[DISCLAIMER: The creators of the NOAA tsunami map work in my building. I secretly fangirl squeal when I walk past their offices. I recently had coffee with Joke F. Lübbecke, who also works in my building. It was caffeinated.]
*Confusingly, oceanographers also co-opted the acronym Sv for Sverdrups their unit for volume transport. 1 Sverdrup = 1 Sv = one million cubic metres per second = 400 Olympic swimming pools just passed your house in one second.
SOURCES:
Behrens, Erik, et al. “Model simulations on the long-term dispersal of 137Cs released into the Pacific Ocean off Fukushima.” Environmental Research Letters 7.3 (2012): 034004.
Buesseler, Ken O., et al. “Fukushima-derived radionuclides in the ocean and biota off Japan.” Proceedings of the National Academy of Sciences 109.16 (2012): 5984-5988.
Fisher, Nicholas S., et al. “Evaluation of radiation doses and associated risk from the Fukushima nuclear accident to marine biota and human consumers of seafood.” Proceedings of the National Academy of Sciences (2013).
Nakano, Masanao, and Pavel P. Povinec. “Long-term simulations of the 137 Cs dispersion from the Fukushima accident in the world ocean.“ Journal of environmental radioactivity 111 (2012): 109-115.
Rossi, Vincent, et al. “Multi-decadal projections of surface and interior pathways of the Fukushima Cesium-137 radioactive plume.“ Deep Sea Research Part I: Oceanographic Research Papers (2013).
Woods Hole Oceanographic Institution FAQ: Radiation from Fukushima
Explained: rad, rem, sieverts, becquerelsl. A guide to terminology about radiation exposure